The Prut River under Climate Change and Hydropower Impact


1
International Association of River Keepers “Eco-Tiras”, 11a Teatrala St., MD-2012 Chisinau, Moldova
2
Faculty of Sciences and Environment, ReForm-UDJG Multidisciplinary Platform, INPOLDE Research Center, Dunarea de Jos University of Galati, 47 Domneasca St., 800008 Galati, Romania
3
Institute of Zoology, 1 Academiei St., MD-2028 Chisinau, Moldova
*
Author to whom correspondence should be addressed.
Sustainability 2021, 13(1), 66; https://doi.org/10.3390/su13010066
Submission received: 1 November 2020
/
Revised: 16 December 2020
/
Accepted: 19 December 2020
/
Published: 23 December 2020
(This article belongs to the Special Issue Sustainable Management of Semi-aquatic Ecosystems)
Abstract
:Climate change and intensive hydropower development pose serious challenges to the sustainable water supply of natural and social systems. This study’s purpose is to statistically estimate the complex influence of these factors on the Prut River flow. Its methodical approach is based on a comparative analysis of the flow in 1961–1990 and 1991–2018, reflecting the regional climate before and after an intensive global warming onset, and in 1950–1975 and 1980–2017, before and after the construction of the Stanca-Costesti hydropower plant (HPP) on the Prut’s riverbed. The compared statistics include annual, seasonal and monthly averages and trends of climatic and hydrological parameters for each period. Since the 1990s a statistically significant increase has been demonstrated in the basin-wide annual mean, maximum and minimum temperatures, of 1.04, 1.11 and 1.21 °C, respectively. Negative trends of annual precipitation were negligibly small and statistically insignificant in both periods (−2.1 mm and −0.6 mm/year, respectively), with annual totals differing by 1.4 mm. The seasonal transformation and changes of the Prut river flow, showing a small annual increase in the period 1961–1990 and a 1.8% decrease over next decades, are in good agreement with variability patterns of temperature (positive tendencies) and precipitation (negative tendencies). The operation of mean-capacity HPP has no significant impact on the total water discharge downstream, but modifies the seasonal distribution of the river’s streamflow.
1. Introduction
Prut River is one of the main left-bank tributaries of the Danube River and one of the largest rivers in Romania, Moldova and Western Ukraine. In general, it is classified as being vulnerable from economic, social and ecological points of view and sensitive to climate change impacts [1,2].
It is well known that anthropogenic activities and climate change trigger the modifications in the hydrological regime of rivers, increasing the severity of issues associated with water security in their basins [3,4,5,6]. Water is a sector impacted to a large extent by climate change. Recent reports highlight the central role of healthy rivers in adapting to climate change [7], showing that freshwater conservation must stay at the basis of adaptation agendas and efforts [8,9]. Thus, the careful management of water through nature-based solutions is a crucial element in tackling the most serious global climate risks.
According to the latest Intergovernmental Panel on Climate Change, (IPCC) Assessment Report [10], human activities have caused approximately 1.0 °C of global warming above pre-industrial levels, and the warming is likely to reach 1.5 °C between 2030 and 2050 if it continues to increase at the current rate—about 0.2 °C per decade (between 0.1 °C and 0.3 °C, depending on the region) due to past and ongoing anthropogenic emissions. The future climate-related risks depend on the rate, duration and peak of warming, especially if the peak temperature is high (e.g., about 2 °C) [10]. Some impacts, such as ecosystems loss, may be long-lasting or irreversible. Changing temperature and precipitation impact flow-rates in freshwater or riverine ecosystems and bring changes to water supplies and demands, affecting human well-being, economy, especially agriculture, ecosystems and their services [11,12,13]. Moreover, global warming is accompanied by an increase in climatic extremes, and in temperate continental climates the heavy rains create favorable conditions for extreme floods [14,15]. For example, a historical eight-day flood, with a probability of 0.1%, occurred in the Prut River basin in July 2008. The water discharge of this flood was 4240 m3/s—the second highest value ever recorded in Romania—and it affected 51.83 km2 of agricultural land and human settlements over 36.5 km of the river bed [16,17].
Due to their contribution to a wide range of public goods and services, freshwater, in general, and rivers, in particular, occupy a special place in climate resilience assessments [9]. Because most rivers are within watersheds already affected by human activities, the observed change in climate will add to or magnify present risks through its potential to alter rainfall, temperature and runoff patterns, correspondingly disrupting the biological communities and their ecological linkages. As a result, many users will face a shortage in their water supplies, with dramatic consequences, threatening public health, weakening economies and decreasing the quality of life. In this regard, the Prut River as an object of this study is not an exception [1,18].
Nonetheless, hydropower development has an undoubted impact on the rivers’ adaptive response to climate change [19]. As one of different anthropogenic factors affecting surface water resources, hydropower development has acquired new nuances on the background of a changing climate, introducing new aspects to the relationship between renewable energy and water resources. Moreover, Qi et al. [20] quantified the contribution to hydrological droughts of both climate and land use/land cover (LULC) change and river dam construction, proving that all these factors led to a streamflow decline in a marshy river, the most influential factor being dam construction. If climate change was a main driver of the increase in drought events, then LULC and the reservoir building would be responsible for the severity of droughts.
The transformation of a hydrological cycle, due to climate change, leads to a variety of impacts and risks caused by the interaction of climatic and non-climatic transformation stimuli with their responses to water resources management. Hydropower projects are often promoted as a “clean and green” source of electricity, and, based on this perspective, many countries are stepping up their expansion. According to the survey [21], hydropower is currently the leading renewable source of energy, contributing to the production of two-thirds of the global electricity from all renewable sources combined. Hydropower-generated electricity is expected to increase from 45% presently to 70% by 2040, depending on future policies, with 3700 new hydroelectric facilities either planned or under construction. The last inventory of massive hydropower presence in European rivers [22] reveals a total of 30,172 hydropower plants (HPPs), of which 21,387 already exist, 8507 are planned and 278 are already under construction. Numerous HPPs also exist or are planned in the Black Sea basin [23].
Undoubtedly, the HPPs’ water storage reservoirs provide multiple benefits due to water accumulation and supply, flood control and recreational opportunities. However, the relationship between hydropower, climate change and water security is not so unambiguous. First of all, an HPP requires a river to be dammed in order to create a reservoir for water storage [24]. In European rivers, numerous dams, weirs and sluices have a strong negative impact on river ecology and biodiversity. According to [25]’s estimates, based on analysis and field validations, there is almost one barrier for each river kilometer in Europe, a density that is much higher than previously indicated in the national databases. The well-known detrimental effects of dams also include the impoundment of free-flowing river habitats, blockage of fish migration and reduced water quality in reservoirs and river reaches downstream [26,27,28,29]. A study of these shortcomings is especially important when considering the combined impact of climate change and hydropower [30,31]. Adynkiewicz-Piragas and Miszuk [32] have estimated that the future will bring a very high risk of decrease in water resources and in hydropower production. According to their results, increasing air temperatures and sunshine durations can negatively affect water resources, even though precipitation projections do not show significant trends.
The complexity of coordination between the water, energy and environmental sectors increases substantially in transboundary river basins where the impacts spread from one country to another, and trade-offs and externalities can cause friction between riparian countries. The management of interlinked resources leads to a “nexus approach” as a way of enhancing water and energy security by increasing its efficiency, building synergies and improving governance, while protecting ecosystems [33]. However, in spite of some common features, each river basin has significant differences, requiring a careful, thorough study and individual accounting for the transboundary monitoring of flow. A basin-wide approach is one of the principal dimensions in river basin management [34,35].
The assessment of the sustainability of HPP work must take into account climate variability and change, and climate challenges should be integrated into all assessment methods [36]. Although these impacts have been partially taken into account in the scientific literature for the Prut River [2,37,38], a new, more detailed and statistically comprehensive analysis is needed, based on historical information from two riparian countries—Romania and the Republic of Moldova. The aim of this paper is to analyze and statistically estimate the complex influence of climate change and hydropower on the water flow of the transboundary Prut river. This study will help policy makers, water managers, researchers and farmers to understand the potential impacts of climate change and hydropower and to adapt the appropriate water management strategies.
2. Materials and Methods
2.1. Study Area
The transboundary Prut River is the second longest tributary of the Danube River, its sub-basins being located in Romania, Moldova and Ukraine (Figure 1a) [39]. It originates in the south-western slope of the Hoverla Mountain, at about 15 km south-southeast of Vorokhta village, in the Chornogora mountain massif of the Ukrainian Carpathians, and flows into the Danube at about 164 km from its mouth, 0.5 km south-eastwards of Giurgiulesti village. The river’s length is 967 km and its catchment area (i.e., an area that drains to a single stream or river (McCabe 2011); synonyms such as river basin and watershed are also used in North America) is 27,540 km2. The studied area occupies the part of the Prut basin which is located in eastern Romania and western Moldova; it accounts for 68.2% of the entire Prut basin [40]. The length of the transboundary part between Romania and Moldova is 711 km. As for its shape, the basin is a relatively narrow band, with an average width of 51 km (up to 70 km). The geological structure of this area comprises a large variety of rocks with different physical and chemical properties that play a main role in the formation of the basin’s structure, topography, hydrographic network, and ground waters. The Moldovan Plateau, in which the studied area is located, has the maximal absolute altitude, 429.5 m (the Codri Hills), and the minimal one, 2.4 m, in the Prut mouth. The mean altitude is 130 m, with an average slope of 0.2% [16].
The mountainous hydrological origin of Prut accounts for its sufficiently large water content, but also for the frequent floods, representing real hazards for both Moldova’s and Romania’s economy and human security [16]. However, the Prut basin belongs to a zone of insufficient humidity [2]. Precipitations decrease from north to south with significant spatial heterogeneity depending on the terrain. Because the wind’s prevailing directions are north-west and west, the highlands receive higher precipitation compared to the downwind slopes.
According to historical observations, the annual precipitation amounts to approximately 900 mm in the northern and central parts of the basin, but is less than 270–300 mm in the south [41]. The Prut’s average annual streamflow amounts to 2.7 km3, varying from 1.2 km3 in the years with insufficient precipitation to 5 km3 in the years with the highest surface runoff [41]. These and other characteristics also depend on changes in the regional climate and in the Stanca-Costesti HPP works. According to this study, in 1980–2017—that is after putting this HPP into operation—at the hydrological post Oancea, an annual water discharge was, on average, 91.6 m3/s, ranging from 38.4 to 150.4 m3/s.
This HPP, jointly operated by Romania and Moldova, was built in the period 1974–1978, using as a reservoir the Stanca-Costesti Lake, located in the Prut (Figure 1b), at 580 km from its confluence with the Danube [42]. To build a reservoir, the lake was blocked by a dam with a height of 47 m and a length of 740 m, retaining a gross volume of 1285 million m3 and used volume of 450 million m3. The reservoir’s area is 59 km2, and the maximum depth 41.5 m. The HPP’s capacity is 32 MW (two hydraulic units of 16 MW each), and its designed annual electricity production is 130 million kWh. According to the European classification [22], this facility belongs to a size class 3 (from 10 to 50 MW).
However, the main goal of this complex construction is not only to generate electricity. It also regulates the Prut’s streamflow and provides water accumulation to supply riparian settlements, industrial enterprises and agricultural irrigation, and to attenuate high floods. In particular, the Stanca-Costesti reservoir has prevented the potentially catastrophic consequences of the above-mentioned historical flood of 2008 [17]. Nevertheless, the HPP and its reservoir have altered the river water flow, which, especially in dry years, was sometimes below an ecological minimum, thus affecting the hydrological regime of floodplain lakes and the Lower Prut scientific reserve.
2.2. Initial Material
The transboundary nature of the Prut River and the shape of its basin (a relatively narrow band) have made it possible to use a corresponding approach to the selection of an initial material. In particular, historical climatic information was provided by Moldova and hydrological information—by Romania. Partially, such approach was also driven by the specifics of this study, carried out in an international project framework (see: Acknowledgements). Thus, the climate change study was based on data series of four Moldovan weather stations located within the study area (Figure 1), while monthly observation data at three Romanian hydrological stations (Figure 1; Table 1) served as an initial material to analyze the Prut water multi-year discharge.
The choice of hydrological stations was made based on the need to correctly assess a twofold impact on the Prut’s flow: (1) of the climate change and (2) of the Stanca-Costesti HPP and its reservoir. From the former point of view, the gauging station in Radauti is the best choice. Located upstream the reservoir at a distance of about 300 km from the Prut source, it records a long-term (since 1950) water flow generated in the upper part of the Prut basin, not being disturbed by the HPP construction and operation. This factor allows for the correct assessment of a possible contribution of global warming to changes in the Prut’s streamflow. The Stanca gauging station is important as the closest one downstream of the HPP (about 20 km), which also has a fairly long (since 1950) series of reliable measurements of water discharge. The station in Oancea records the Prut’s streamflow in its lower part, or practically a total runoff from the basin, because the Prut has no significant tributaries downstream.
2.3. Methods
A difference in tasks to be solved has determined the choice of methods and time periods for the study. In particular, climate, in its narrow sense, is defined as the average weather, or more rigorously, as the statistical description of key climatic variables in terms of their means and variability over a certain period of time [43]. Thus, it is very important to select the correct period of averaging, and its duration is one of potential sources of uncertainty and bias in the research results. This moment is important not only when choosing a “reference climate”, or “baseline” time period, from which the potential climate change projections are estimated (e.g., [44]), but also in identifying any changes in the current climate. Unfortunately, in a number of works, including some of those cited below, a choice of time periods for averaging has often been governed by the availability of historical observations data. However, according to the current World Meteorological Organization’s (WMO) Technical Regulations [45], climatological standard normals are defined as averages of climatic data computed for successive 30-year periods, updated every 10 years. Based on this definition, to define changes in the Prut basin climate two 30-year (1961–1990 and 1991–2018) periods were compared. These periods reflect, respectively, the relatively “normal” regional climate of the second part of the 20th century and the climate of intensive global warming that has been observed over the last three decades. Some objective “shortening” of the second period (28 years) can be neglected.
To assess climate change impacts on the Prut water discharge, by analogy with the analysis of changes in temperature-humidity conditions, the 1961–1990 and 1991–2018 periods were chosen as well. In turn, to assess the HPP impacts, the water discharge was compared taking into account the periods before this plant construction (1950–1975) and after putting it into operation (1980–2017).
Methodical approaches to assess changes in the climate and the Prut’s streamflow included three main components:
- The study of time trends in historical data. Usually, a trend analysis of meteorological elements that are perceived as different aspects of climate, which can be statistically described, e.g., air temperature and precipitation [45], provides useful information for understanding the climatic changes associated with global warming. Equally, the trend analysis of streamflow characteristics is important for water resources management [46,47]. In the most recent relevant publications, these variables are considered both individually and in their various combinations. Thus, Hammad and Salameh [48] have used air temperature trends to indicate changes in climate in the Central Palestinian Mountains, Ge et al. [49] in the Indochina Peninsula and Jeganathan et al. [50] in one Indian state. In turn, Zhao et al. [51] explored linear trends for analyzing mean and extreme precipitation under climate change within the Yellow River Basin (China), while Szwed [52] analyzed the variability of precipitation in Poland. More often, however, the temperature and precipitation trends are considered concurrently. As examples, we can name the works of Ay [53] for the western Black Sea region and Scorzini and Leopardi [54] for Central Italy, or some work for more remote areas, e.g., Machiwal et al. [55] for India’s arid region. Nikzad Tehrani et al. [56] evaluated the trends of hydro-climatic variables (precipitation and streamflow) in northern Iran. Yan et al. [57] investigated the individual and combined effects of LULC and climate change on water balance in the upper reaches of the Beiluo River basin, in China. Their research showed that these future effects are similar to trends of climate change at both the annual and seasonal scales. Lately, a basin-wide approach has been increasingly used in trend analysis [51,58,59,60,61]. In the present study, trends of air temperature and precipitation over selected climatic periods were also chosen as principal indicators of observed tendencies in climate dynamic and climatic conditions, which form a surface runoff from the Prut River’s catchment and its potential change, expressed in trends in the river water discharge.
- A descriptive analysis was used to describe and compare basic features of the Prut catchment’s temperature-humidity conditions in the selected climatic periods. Descriptive statistics included annual and seasonal averages and standard deviations (Sd) of mean (Tmean), maximum (Tmax) and minimum (Tmin) air temperatures, and analogous statistics for precipitation (p) totals and water discharge (Q).
- An assessment of the statistical significance of observed differences between estimated statistics for the two periods, considered as a sound evidence of the presence or absence of reliable changes in the regional climate and the Prut’s streamflow.
All statistical analyses were performed using appropriate tools provided by the Microsoft Excel 2019 and Statgraphics (2014) software (STATGRAPHICS Centurion XVII, Statpoint Technologies, Inc., Warrenton, VA, USA) [62].
3. Results
3.1. Climate Change in the Prut River Basin
3.1.1. Air Temperature Trends
Figure 2 demonstrates changes in annual trends of air temperature in the Prut basin caused by global warming. It is clear that the decrease of mean and maximum temperatures and only a slight increase of the minimum temperature in 1961–1990 shifted to their sharp increase in the last thirty years. The most important statistics characterizing linear trends of annual and seasonal temperatures, as well as their comparison analysis, are presented in Table 2. In this analysis, a slope shows the value of a corresponding temperature change per year, while its sign indicates the direction of the change. A p-value less than 0.05 means the statistical significance of the linear regression model at 95.0% or higher confidence level; R2 statistic (or coefficient of determination) indicates the percent of an estimated parameter’s variability explained by the model, or a level of its value dependence in a year [62].
The analysis of Table 2 leads to the following conclusions:
- since the 1990s, in the Prut basin, a sharp increase in the annual air temperature has been observed for all its parameters; this increase for Tmin, Tmean and Tmax amounted, per decade, to about 0.6, 0.8 and 0.9 °C, respectively, compared to 0.04, −0.01 and −0.07 °C in 1961–1990;
- unlike 1961–1990, the observed trends of regional warming in 1991–2018 have a high level of statistical significance: p-values for all seasons (except winter) and for the entire year are less than 0.001.
The previous conclusion is confirmed by a sharply increased R2: in the last three decades, in all seasons, except for winter, the linear trends explain from about 35% to more than 50% of the air temperature’s variability.
3.1.2. Statistical Significance of Air Temperature Change
Table 3 shows the results of an evaluation of the statistical significance of the differences between temperature averages and their standard deviations in two climatic periods. As can be seen, in 1991–2018 the annual averages of Tmin, Tmean and Tmax have increased by 1.04, 1.11 and 1.21 °C, respectively, relative to the previous 30 years. In absolute terms, the maximal increase of all temperature characteristics was observed in summer, and the minimal increase in winter.
To determine whether or not the differences between temperatures in the two periods are statistically significant, the Sample Comparison procedure was used [62]. This procedure runs a t-test to compare the averages of two samples. Except for one case (autumn Tmax), all increases are statistically significant with p-values < 0.05; this means that the observed increase of air temperature in 1991–2018 in comparison with 1961–1990 is reliable at a confidence level of 95.0% or higher.
To compare the standard deviations (Table 3), the F-test was run. Since this time the computed p-values in most pairs are not less than 0.05 (except in summer for Tmax), there are no statistically significant differences between Sd in the two temperature samples at an acceptable confidence level. Thus, we can argue that the observed increase in air temperature was not accompanied by a corresponding change in its variability.
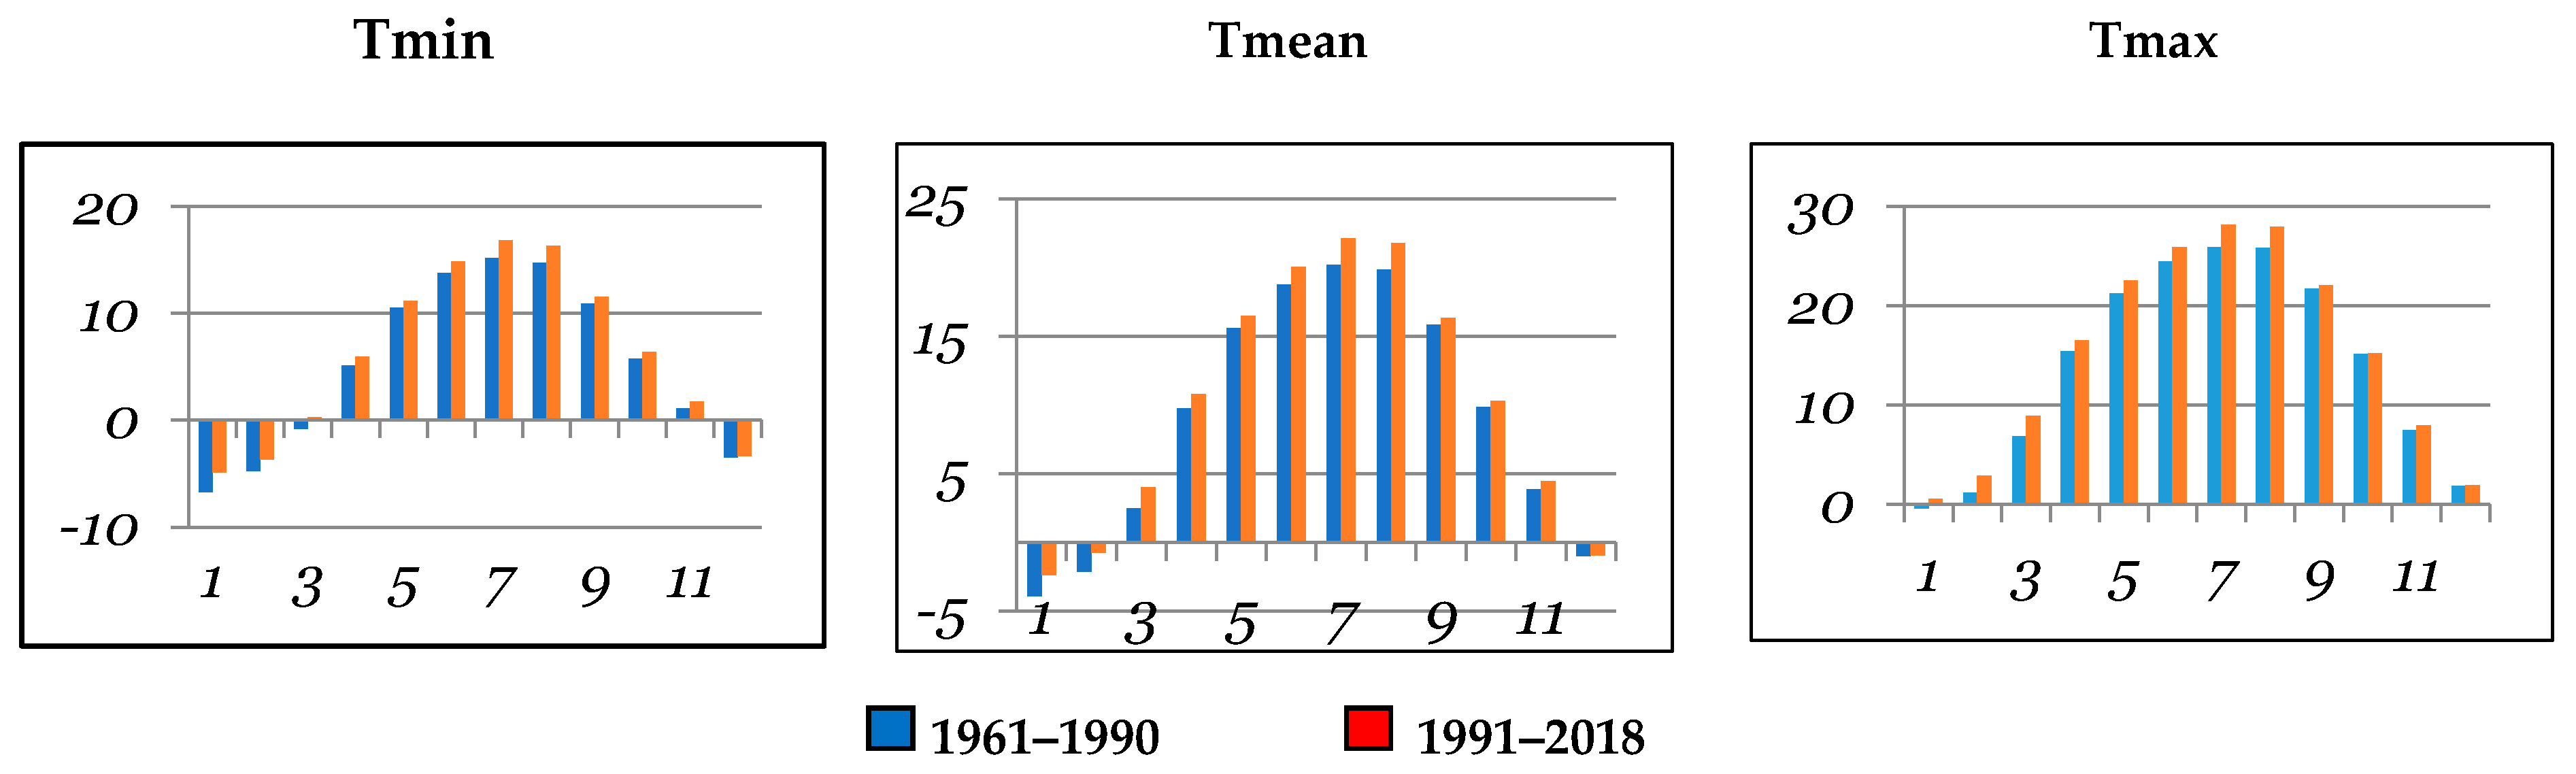
3.1.3. Changes in the Course of the Mean Annual Temperature
Though the Prut basin air temperature is changing, its annual course is preserved (Figure 3), with minimal values in January-February and maximal ones in July–August. At the same time, a temperature increase is visually observed practically in all months and for all temperature parameters.
3.2. Precipitation Change
Precipitations in the form of rain and snow are a primary source of surface runoff in the Prut catchment. In both study periods, negative trends in annual precipitation took place, although they were negligibly small: about −2.1 mm and −0.6 mm per year in 1961–1990 and 1991–2018, respectively (Figure 4; Table 4). In the first period, a decrease in precipitation was observed in winter and spring, but in subsequent years in all seasons except winter. However, none of these trends are statistically significant (p-values are much higher than 0.05), and both graphs demonstrate an extreme interannual variability of basin-wide precipitations, with a consecutive dry and wet years occurring many times since 1961.
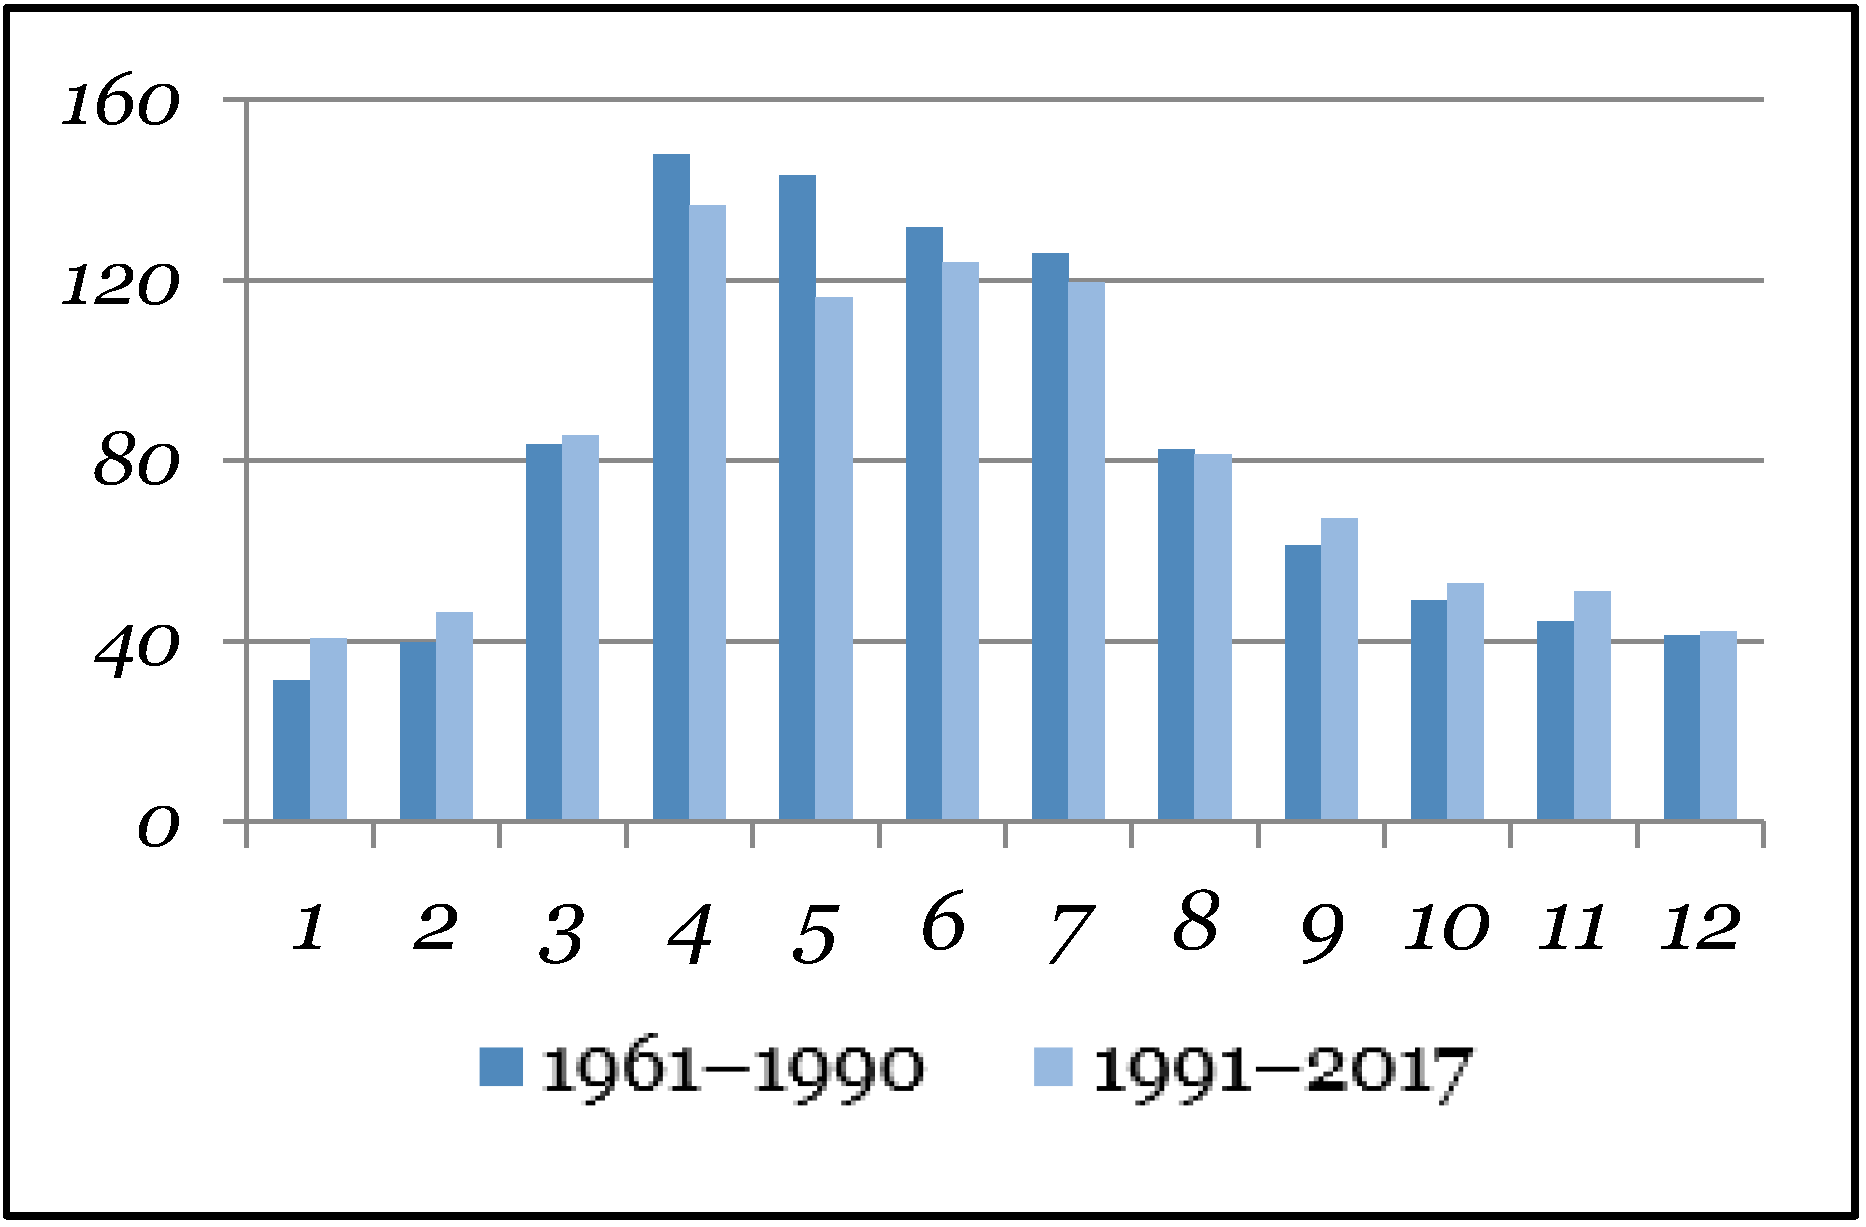
This fact, along with insignificant values of R2, gives us no grounds to speak about significant decreases in the total amount of precipitation falling in the Prut basin. Such conclusion is supported by the statistical comparison of precipitation averages and standard deviations (Table 5): the differences between their values in two periods are not statistically significant for all seasons, and their annual totals differ by about 1.4 mm. However, it is worth drawing attention to an obvious increase in autumn precipitation with a decrease in other seasons.
Although the total annual precipitations remain almost unchanged, their certain redistribution by months is observed (Figure 5). So, the monthly precipitation maximum (82 mm), which was in 1961–1990 in June, is now decreased to 75 mm and is observed in July. The previous monthly precipitation minimum (October, 27 mm) in the last decades has disappeared as such, and the new minimum has shifted to February (28 mm). Other (not so significant) changes in precipitation patterns are also observed in the rest of the months.
3.3. Changes in the Prut’s Streamflow
Climate Change Impact on the Prut’s Water Discharge
As was noted above (Section 2), the impact of climate change on the Prut’s streamflow was estimated based on historical observations at Radauti hydrological station, located upstream of the Stanca-Costesti HPP. Thereby, a possible transformation of the river flow, caused by the HPP factor, was excluded. The streamflow analysis itself, by analogy with the basin-wide climate change assessment, included a comparison of water discharges and their trends in 1991–2017 vs. 1961–1990.
Linear trends of the Prut’s annual water discharge are shown in Figure 6, and their statistics, along with seasonal ones, in Table 6. Even visually, one can see that a slight increase in the annual discharge in 1961–1990 shifted to a decrease over the next decades. This decrease, which has been outlined since the mid-1990s, is in good agreement with the beginning of an intense global warming; it continues throughout the following years in all seasons. In the 1991–2017 period, a previous spring decrease (−0.556 m3/s) had approximately doubled to −1.189 m3/s; no less demonstrative is the change in the autumn discharge: from a positive trend (0.401 m3/s) in the first period to a more intense subsequent negative decrease (−1.273 m3/s).
In Table 6, as in the analysis of climatic variables, the R-squared statistic indicates the percent of variability of water discharge explained by a linear model. Very small values of this statistic demonstrate a weak relationship between a discharge by trend and the corresponding year. Such conclusion is supported by the fact that practically all p-values, except for autumn in 1991–2017, are higher than 0.05. Thus, the observed trends are not statistically significant at the 95.0% or higher confidence level. In the absence of statistical significance, along with an extremely small R2, there is no reason to argue about a time stability of observed trends in the Prut’s water discharge. It is possible that they only reflect shallow- and large-water periods in flows, well known in hydrology. Such conclusion is supported by the analysis of standard deviations characterizing the variability of water discharge in Radauti station (Table 7). According to this table, the coefficient of variation of an annual discharge, calculated as a ratio of Sd to Average values, equals, in the compared periods, 33.4% and 36.6%, respectively, or a third of the averages.
In general, Table 7 allows us to extract information about the absolute and relative changes in the Prut’s water flow due to climate change. Although in all seasons the observed differences in water discharge are statistically insignificant (all p-values > 0.05), their certain patterns are undeniable, being in good agreement with global estimates, and can be summarized as follows:
- the approximately 15% increase of the Prut’s streamflow in winter and its 9.7% decrease in spring are in good agreement with the increase in basin-wide winter temperatures (Table 3) and, accordingly, the earlier onset of spring floods;
- an increase of the streamflow in autumn and its decrease in summer are in good agreement with the 21.9% increase in autumn precipitation and 9.2% decrease in summer (Table 5);
- the seasonal transformation of water discharge is in good agreement with the seasonal redistribution of precipitation.
Thus, despite the seasonal redistribution of the Prut’s streamflow caused by climate change, its annual volume entering the territory of Romania and Moldova in the upper part of the river basin has decreased very slightly—only by 1.8%. Nevertheless, in a purely physical perspective, this decrease is in good agreement with observed air temperature increases and precipitation decrease. The climate change impact on the Prut discharge variability is demonstrated by a statistically significant increase of Sd observed only in summer (~1.5 times) and a similar Sd lowering (~1.4 times) observed in winter. However, the difference between the interannual variability in two periods is much lower (7.7% increase).
The changes in the Prut’s water flow discussed above, caused by climate change, are well detailed when considering a monthly water discharge (Figure 7). While maintaining the form of its annual distribution, the ratios of its monthly values have changed significantly. In particular, the last decade’s monthly increase took place mainly in January–February and September–November against the four-month decrease in April–July, with its maximum in May.
3.4. Hydropower Impact on the Prut’s Water Discharge
In accordance to a chosen methodology, the assessment of changes in the Prut’s flow due to the operation of the hydropower complex Stanca-Costesti was based on comparison of its water discharge at two hydrological stations: Radauti, located upstream, and Stanca, located downstream of this complex (Figure 1), in the periods before and after its construction. To exclude from the analysis the construction period, 1950–1975 and 1980–2017 years were considered for the comparison. Monthly water discharges in these two reaches of the Prut River are shown in Figure 8.
This histogram should be interpreted as a type of “qualitative” assessment of a hydropower impact on the Prut’s streamflow. Thus, in 1950–1975, when the streamflow was undisturbed, the annual water discharges at both hydrological posts were almost identical in shape. Somewhat larger volumes at Stanca gauging post are explained by a natural increase in the surface runoff caused by an increase in the catchment area downstream of Radauti (see Table 1). The observed changes in water discharge in Radauti in 1980–2017, e.g., its slight reduction and transforming over a year, can be explained by purely natural factors: its response to changes in the basin’s drainage characteristics or to the variability of precipitation, temperature and evapotranspiration caused by changes in regional climate. At the same time, in Stanca, the modification of the water discharge is more pronounced. Such a conclusion is supported by a comparative analysis (Table 8). In particular, while at Radauti gauging post the difference in the water discharge (both values and variability) in the two periods is not statistically significant (p-values are much higher than 0.10), at Stanca post these differences are statistically significant in all seasons, except for summer and the entire year. A winter increase in water discharge here (above 30%) can be partially explained by earlier snow melting, while a substantial decrease in the spring discharge (−21%) is most likely caused by a regulated accumulation of water in the Stanca-Costesti reservoir for economic, environmental or social needs in a warm period. This conclusion is confirmed by a water discharge increase in summer and autumn. As a result, the natural excess of an average annual discharge in Stanca in comparison with Radauti (by 2.9 m3/s), which took place in 1950–1975 due the greater catchment area, has decreased to 1.9 m3/s in 1980–2017. Here, we should also take into account that the Stanca-Costesti reservoir collects water not only from the Prut’s flow but also from a number of side tributaries, from both its banks, for which the total flow can reach 1 m3/s [42].
4. Discussion and Conclusions
Based on the analysis of historical data and the use of modern statistical approaches, a comprehensive research on responses of the Prut River flow to climate change and hydropower development yields some original results, which add new information to these pressing problems. The main generalized conclusions which can be drawn from the obtained results are formulated as follows:
- The changes in temperature-humidity conditions of the Prut River basin in the periods before and after the global warming onset clearly demonstrate its obviousness in a regional manifestation. Since the 1990s, a substantial increase in the annual air temperature has been observed for all parameters, and their positive trends have a high level of statistical significance, or reliability. In 1991–2018 the annual averages of Tmin, Tmean and Tmax have increased, respectively, by 1.04, 1.11 and 1.21 °C relative to the previous thirty years. What is important is that the observed changes are statistically significant, with a confidence level of 95.0% and higher. However, the obvious temperature increase, which took place in all months, was not accompanied by a statistically significant change in temperature interannual variability.
- The negative trends of annual precipitation totals were observed in both periods, but they were negligibly small and statistically insignificant: about −2.1 mm and −0.6 mm per year in 1961–1990 and 1991–2018, respectively. In the first period, a precipitation decrease was observed in winter and spring, in subsequent years—in all seasons except winter. The resulting decrease in the annual precipitation average was only 1.4 mm. A high interannual variability of precipitation, inherent in both periods with successive wet and dry years, often led to atmospheric and hydrological droughts. The latest example is the drought in Moldova in 2020.
- A slight increase in the Prut’s annual water discharge, observed in 1961–1990, shifted to a decrease over the next decades, a trend which is in good agreement with the strengthening of global warming. However, in the absence of statistical significance, there is no reason to argue about a time stability of observed trends, and they are very likely to reflect only the shallow- and large-water periods. Despite a transformation of the Prut water discharge’s seasonal distribution under climate change, its annual volume entering the territory of Romania and Moldova has decreased very slightly—only by 1.8%. In a hydro-climatologic perspective, this fact is in good agreement with the observed air temperature increase and precipitation decrease.
- The creation of the Stanca-Costesti reservoir and the construction of a mean-capacity HPP have not showed a statistically significant effect on annual water discharge downstream, but changed its seasonal distribution according to the interests of certain water users. Thus, it can be assumed that hydropower, with an optimal combination of its capacities and the volume of surface runoff flowing into a riverbed, as well as with competent management, makes it possible to combine energy, economic and environmental requirements in a river basin, in particular, maintaining the sustainability of water supply in the lower part of the Prut basin.
As a concluding remark, the authors would like to emphasize that the climate transition to a new state requires in-depth research, taking into account all applied aspects and hydropower. This is especially important for all systems related to freshwater, which is most sensitive to climate change and its variability. The new climate impacts natural and social systems either directly, through changes in air temperature-humidity conditions, or indirectly, transmitting its adverse consequences through transformations in a river flow. There is also no doubt that any hydropower construction in the riverbed introduces an additional dimension to these challenges, including those related to the sustainability issue as a whole.
Author Contributions
Conceptualization, R.C., A.E. and I.T.; data curation, A.E., I.T. and E.Z.; funding acquisition, A.E. and E.Z.; investigation, R.C. and I.T.; methodology, R.C. and I.T.; project administration, I.T. and E.Z.; resources, A.E. and I.T.; software, R.C.; supervision, A.E. and I.T.; validation, R.C.; writing—original draft, R.C., A.E. and I.T.; writing—review & editing, R.C., A.E., I.T. and E.Z. All authors have read and agreed to the published version of the manuscript.
Funding
The APC was funded by “Dunarea de Jos” University of Galati, Romania.
Data Availability Statement
The data that support the findings of this study are available from the corresponding author, AE, upon reasonable request.
Acknowledgments
The current work was achieved in the frame of the project with code BSB 165 “HydroEcoNex”, funded by the European Union through the Joint Operational Programme “Black Sea Basin 2014–2020”. The content of this publication is the sole responsibility of the authors, and in no case should it be considered to reflect the views of the European Union. The authors are grateful to “Romanian Waters” National Administration for providing, on request, the monthly hydrological data for different periods of interest for the selected hydrological stations (Radauti, Stanca and Oancea) in Prut River, Romania. We also wish to thank the two anonymous reviewers and the Academic Editor for their thorough analysis of the manuscript and valuable comments, which significantly contributed to the improvement of the paper.
Conflicts of Interest
The authors declare no conflict of interest.
References
- Minea, I. The vulnerability of water resources from Eastern Romania to anthropic impact and climate change. In Water Resources Management in Romania; Negm, A.M., Romanescu, G., Zeleňáková, M., Eds.; Springer Water; Springer Nature: Cham, Switzerland, 2020; pp. 229–250. [Google Scholar] [CrossRef]
- Potopová, V.; Cazac, V.; Boincean, B.; Soukup, J.; Trnka, M. Application of hydroclimatic drought indicators in the transboundary Prut River basin. Theor. Appl. Climatol. 2019, 137, 3103–3121. [Google Scholar] [CrossRef]
- Laušević, R.; Milutinović, S.; Petersen-Perlman, J.; Reed, M.; Graves, A.; Bartula, M.; Sušić, S.; Popović, A. Local Water Security Action Planning Manual; Laušević, R., Ed.; Regional Environmental Center: Szentendre, Hungary, 2016. [Google Scholar]
- MacQuarrie, P.; Wolf, A.T. Understanding Water Security. In Environmental Security: Approaches and Issues; Floyd, R., Matthew, R.A., Eds.; Routledge, Taylor & Francis Group: London, UK, 2013; pp. 169–186. [Google Scholar]
- WaterAid. Water Security Framework; WaterAid: London, UK, 2012; Available online: https://washmatters.wateraid.org/sites/g/files/jkxoof256/files/download-our-water-security-framework.pdf (accessed on 19 December 2019).
- UNU. Water Security and the Global Water Agenda. A UN-Water Analytical Brief; United Nations University: Hamilton, ON, Canada, 2013. [Google Scholar]
- WWF; AB InBev. Climate Change and Water: Why Valuing Rivers is Critical for Adaptation. 2019. Available online: https://d2ouvy59p0dg6k.cloudfront.net/downloads/wwf_abi_water_climatechange__final_.pdf (accessed on 17 January 2020).
- UNECE. Water and Climate Change Adaptation in Transboundary Basins: Lessons Learned and Good Practices; United Nations Publication: Geneva, Switzerland, 2015. [Google Scholar]
- Yan, K.; Pottinger, L. Civil Society Guide to Healthy Rivers and Climate Resilience; International Rivers: Berkeley, CA, USA, 2013. [Google Scholar]
- IPCC. Summary for Policymakers. In Global Warming of 1.5 °C. An IPCC Special Report on the Impacts of Global Warming of 1.5 °C Above Pre-Industrial Levels and Related Global Greenhouse Gas Emission Pathways, in the Context of Strengthening the Global Response to the Threat of Climate Change, Sustainable Development, and Efforts to Eradicate Poverty; Masson-Delmotte, V., Zhai, P., Pörtner, H.–O., Roberts, D., Skea, J., Shukla, P.R., Pirani, A., Moufouma–Okia, W., Péan, C., Pidcock, R., et al., Eds.; World Meteorological Organization: Geneva, Switzerland, 2018; pp. 3–24. Available online: https://www.ipcc.ch/site/assets/uploads/sites/2/2019/05/SR15_SPM_version_report_LR.pdf (accessed on 14 August 2020).
- World Bank. High and Dry: Climate Change, Water, and the Economy; World Bank: Washington, DC, USA, 2016. [Google Scholar]
- Mekonnen, M.M.; Hoekstra, A.Y. Four billion people facing severe water scarcity. Sci. Adv. 2016, 2, e1500323. [Google Scholar] [CrossRef] [PubMed] [Green Version]
- Fischer, G.; Shah, M.; van Velthuizen, H. Climate Change and Agricultural Vulnerability. In Special Report as a Contribution to the World Summit on Sustainable Development, Johannesburg 2002; IIASA: Remaprint, Vienna, 2002; Available online: http://pure.iiasa.ac.at/id/eprint/6670/1/XO-02-001.pdf (accessed on 14 August 2020).
- Alfieri, L.; Burek, P.; Feyen, L.; Forzieri, G. Global warming increases the frequency of river floods in Europe. Hydrol. Earth Syst. Sci. 2015, 19, 2247–2260. [Google Scholar] [CrossRef] [Green Version]
- Santato, S.; Bender, S.; Schaller, M. The European Floods Directive and Opportunities Offered by Land Use Planning; CSC Report 12; Climate Service Center: Hamburg, Germany, 2013. [Google Scholar]
- Romanescu, G.; Stoleriu, C. Exceptional floods in the Prut basin, Romania, in the context of heavy rains in the summer of 2010. Nat. Hazards Earth Syst. Sci. 2017, 17, 381–396. [Google Scholar] [CrossRef] [Green Version]
- Romanescu, G.; Cimpianu, C.I.; Mihu-Pintilie, A.; Stoleriu, C.C. Historic flood events in NE Romania (post-1990). J. Maps 2017, 13, 787–798. [Google Scholar] [CrossRef]
- Zaharia, L.; Ioana-Toroimac, G.; Perju, E.R. Hydrological impacts of climate changes in Romania. In Water Resources Management in Romania; Negm, A.M., Romanescu, G., Zeleňáková, M., Eds.; Springer Water; Springer Nature: Cham, Switzerland, 2020; pp. 309–351. [Google Scholar] [CrossRef]
- Savelsberg, J.; Schillinger, M.; Schlecht, I.; Weigt, H. The impact of climate change on Swiss hydropower. Sustainability 2018, 10, 2541. [Google Scholar] [CrossRef] [Green Version]
- Qi, P.; Xu, Y.J.; Wang, G. Quantifying the individual contributions of climate change, dam construction, and land use/land cover change to hydrological drought in a marshy river. Sustainability 2020, 12, 3777. [Google Scholar] [CrossRef]
- Ocko, I.B.; Hamburg, S.P. Climate impacts of hydropower: Enormous differences among facilities and over time. Env. Sci. Technol. 2019, 53, 14070–14082. [Google Scholar] [CrossRef]
- Schwarz, U. Hydropower Pressure on European Rivers: The Story in Numbers; WWF; RiverWatch; EuroNatur; GEOTA, 2019; Available online: https://balkanrivers.net/sites/default/files/European%20Hydropower%20report%202019_w.pdf (accessed on 20 December 2019).
- Vejnovic, I. Broken Rivers: The Impacts of European-Financed Small Hydropower Plants on Pristine Balkan Landscapes; CEE Bankwatch Network: Prague, Czech Republic, 2017. [Google Scholar]
- NCEA (Netherlands Commission for Environmental Assessment). Better Decision-Making about Large Dams with a View to Sustainable Development, 2nd ed.; Policy Document (7199); Dutch Sustainability Unit: Utrecht, The Netherlands, 2017. [Google Scholar]
- Gough, P.; Fernández Garrido, P.; Van Herk, J. Dam Removal: A viable solution for the future of our European rivers. Dam Remov. Eur. 2018. [Google Scholar]
- Jager, H.I.; Bevelhimer, M.S. How run-of-river operation affects hydropower generation and value. Environ. Manag. 2007, 40, 1004–1015. [Google Scholar] [CrossRef]
- Jager, H.I.; Smith, B.T. Sustainable reservoir operation: Can we generate hydropower and preserve ecosystem values? River. Res. Appl. 2008, 24, 340–352. [Google Scholar] [CrossRef]
- McCabe, D.J. Rivers and Streams: Life in Flowing Water. Nat. Educ. Knowl. 2011, 3, 19. Available online: https://www.nature.com/scitable/knowledge/library/rivers-and-streams-life-in-flowing-water-23587918/ (accessed on 18 December 2019).
- Zaimes, G.N.; Gounaridis, D.; Symenonakis, E. Assessing the impact of dams on riparian and deltaic vegetation using remotely-sensed vegetation indices and Random Forests modeling. Ecol. Indic. 2019, 103, 630–641. [Google Scholar] [CrossRef]
- Casale, F.; Bombelli, G.M.; Monti, R.; Bocchiola, D. Hydropower potential in the Kabul River under climate change scenarios in the XXI century. Theor. Appl. Climatol. 2020, 139, 1415–1434. [Google Scholar] [CrossRef]
- Smith, B.T.; Jager, H.I.; March, P.A. Prospects for combining energy and environmental objectives in hydropower optimization. In Proceedings of the Waterpower XV, Chattanooga, TN, USA, 23–26 July 2007; HCI Publications: Kansas City, MO, USA, 2007. [Google Scholar]
- Adynkiewicz-Piragas, M.; Miszuk, B. Risk analysis related to impact of climate change on water resources and hydropower production in the Lusatian Neisse River basin. Sustainability 2020, 12, 5060. [Google Scholar] [CrossRef]
- UNECE. Reconciling Resource Uses in Transboundary Basins: Assessment of the Water-Food-Energy-Ecosystems Nexus; United Nations: Geneva, Switzerland, 2015. [Google Scholar]
- Pegram, G.; Li, Y.; Quesne, T.L.; Speed, R.; Li, J.; Shen, F. River Basin Planning: Principles, Procedures and Approaches for Strategic Basin Planning; UNESCO: Paris, France, 2013. [Google Scholar]
- Negm, A.M.; Romanescu, G.; Zeleňáková, M. (Eds.) Water Resources Management in Romania; Springer Water; Springer Nature: Cham, Switzerland, 2020. [Google Scholar] [CrossRef]
- Mortey, E.M.; Kouassi, K.L.; Diedhiou, A.; Anquetin, S.; Genoud, M.; Hingray, B.; Kouame, D.G.M. Sustainable hydroelectric dam management in the context of climate change: Case of the Taabo Dam in Côte D’Ivoire, West Africa. Sustainability 2019, 11, 4846. [Google Scholar] [CrossRef] [Green Version]
- Corobov, R.; Trombitsky, I.; Syrodoev, G. Comparative analysis of climate change in the Dniester and Prut River basins. In Hydropower Impact on River Ecosystem Functioning, Proceedings of the International Conference, Tiraspol, Moldova, 8–9 October 2019; Trombitsky, I., Zubcov, E., Ene, A., Kovalishina, S., Matygin, A., Eds.; Eco-TIRAS: Tiraspol, Transnistria, 2019; pp. 183–190. [Google Scholar]
- Trombitsky, I.; Corobov, R. Change in climate of the Prut River basin. In Abstract Book, Proceedings of theMONITOX International Symposium Deltas and Wetlands, Tulcea, Romania, 15–17 September 2019; Teodorof, L., Ene, A., Zubcov, E., Spanos, T., Bogdevich, O., Eds.; C.I.T.D.D.: Tulcea, Romania, 2019; pp. 59–60. [Google Scholar]
- International Commission for the Protection of the Danube River (ICPDR). Prut River Basin Overview Map. Sub-Basin of the Danube River Basin District. June 2006. Available online: https://www.icpdr.org/main/sites/default/files/map_prut.pdf (accessed on 10 March 2020).
- Zubcov, E.; Zubcov, N.; Ene, A.; Biletchi, L. Assessment of copper and zinc levels in fish from freshwater ecosystems of Moldova. Environ. Sci. Pollut. Res. 2012, 19, 2238–2247. [Google Scholar] [CrossRef]
- Human Dynamics. The Prut River Basin Management Plan. Cycle I, 2017–2022; Institute of Ecology and Geography of the Academy of Sciences of Moldova: Chisinau, Moldova, 2016. [Google Scholar]
- Vartolomei, F. Stanca-Costesti reservoir the most important water management unit in Prut catchment area. Lakes Reserv. Ponds 2009, 3, 74–84. [Google Scholar]
- IPCC. Annex I: Glossary. In Global Warming of 1.5 °C. An IPCC Special Report on the Impacts of Global Warming of 1.5 °C above Pre-Industrial Levels and Related Global Greenhouse Gas Emission Pathways, in the Context of Strengthening the Global Response to the Threat of Climate Change, Sustainable Development, and Efforts to Eradicate Poverty; Masson-Delmotte, V., Zhai, P., Pörtner, H.-O., Roberts, D., Skea, J., Shukla, P.R., Pirani, A., Moufouma–Okia, W., Péan, C., et al., Eds.; World Meteorological Organization: Geneva, Switzerland, 2018; pp. 541–562. Available online: https://www.ipcc.ch/site/assets/uploads/sites/2/2019/06/SR15_AnnexI_Glossary.pdf (accessed on 14 August 2020).
- Mohammed, R.; Scholz, M. Climate change and water resources in arid regions: Uncertainty of the baseline time period. Theor. Appl. Clim. 2019, 137, 1365–1376. [Google Scholar] [CrossRef] [Green Version]
- WMO Guidelines on the Calculation of Climate Normals, 2017 ed.; WMO-No. 1203; World Meteorological Organization: Geneva, Switzerland, 2017.
- Dinpashoh, Y.; Singh, V.P.; Biazar, S.M.; Kavehkar, S. Impact of climate change on streamflow timing (case study: Guilan Province). Theor. Appl. Climatol. 2019, 138, 65–76. [Google Scholar] [CrossRef]
- Drissia, T.K.; Jothiprakash, V.; Anitha, A.B. Statistical classification of streamflow based on flow variability in west flowing rivers of Kerala, India. Theor. Appl. Climatol. 2019, 137, 1643–1658. [Google Scholar] [CrossRef]
- Hammad, A.A.; Salameh, A.M. Temperature analysis as an indicator of climate change in the Central Palestinian Mountains. Theor. Appl. Climatol. 2019, 136, 1453–1464. [Google Scholar] [CrossRef]
- Ge, F.; Peng, T.; Fraedrich, K.; Sielmann, F.; Zhu, X.; Zhi, X.; Liu, X.; Tang, W.; Zhao, P. Assessment of trends and variability in surface air temperature on multiple high-resolution datasets over the Indochina Peninsula. Theor. Appl. Climatol. 2019, 135, 1609–1627. [Google Scholar] [CrossRef]
- Jeganathan, A.; Andimuthu, R.; Kandasamy, P. Trends of the observed temperature and its variations in the Tamil Nadu State of India. Theor. Appl. Climatol. 2019, 137, 103–116. [Google Scholar] [CrossRef]
- Zhao, Y.; Xu, X.; Huang, W.; Wang, Y.; Xu, Y.; Chen, H.; Kang, Z. Trends in observed mean and extreme precipitation within the Yellow River Basin, China. Theor. Appl. Climatol. 2019, 136, 1387–1396. [Google Scholar] [CrossRef] [Green Version]
- Szwed, M. Variability of precipitation in Poland under climate change. Theor. Appl. Climatol. 2019, 135, 1003–1015. [Google Scholar] [CrossRef] [Green Version]
- Ay, M. Trend and homogeneity analysis in temperature and rainfall series in western Black Sea region, Turkey. Theor. Appl. Climatol. 2020, 139, 837–848. [Google Scholar] [CrossRef]
- Scorzini, A.R.; Leopardi, M. Precipitation and temperature trends over central Italy (Abruzzo Region): 1951–2012. Theor. Appl. Climatol. 2019, 135, 959–977. [Google Scholar] [CrossRef]
- Machiwal, D.; Gupta, A.; Jha, M.K.; Kamble, T. Analysis of trend in temperature and rainfall time series of an Indian arid region: Comparative evaluation of salient techniques. Theor. Appl. Climatol. 2019, 136, 301–320. [Google Scholar] [CrossRef]
- Nikzad Tehrani, E.; Sahour, H.; Booij, M.J. Trend analysis of hydro-climatic variables in the north of Iran. Theor. Appl. Climatol. 2019, 136, 85–97. [Google Scholar] [CrossRef]
- Yan, R.; Cai, Y.; Li, C.; Wang, X.; Liu, Q. Hydrological responses to climate and land use changes in a watershed of the Loess Plateau, China. Sustainability 2019, 11, 1443. [Google Scholar] [CrossRef] [Green Version]
- Aili, T.; Soncini, A.; Bianchi, A.; Diolaiuti, G.; D’Agata, C.; Bocchiola, D. Assessing water resources under climate change in high-altitude catchments: A methodology and an application in the Italian Alps. Theor. Appl. Climatol. 2019, 135, 135–156. [Google Scholar] [CrossRef]
- Luiz Silva, W.; Xavier, L.N.R.; Maceira, M.E.P.; Rotunno, O.C. Climatological and hydrological patterns and verified trends in precipitation and streamflow in the basins of Brazilian hydroelectric plants. Theor. Appl. Climatol. 2019, 137, 353–371. [Google Scholar] [CrossRef]
- Mutti, P.R.; de Abreu, L.P.; de MB Andrade, L.; Spyrides, M.H.C.; Lima, K.C.; de Oliveira, C.P.; Dubreuil, V.; Bezerra, B.G. A detailed framework for the characterization of rainfall climatology in semiarid watersheds. Appl. Clim. 2020, 139, 109–115. [Google Scholar] [CrossRef]
- Rahimi, D.; Hasheminasab, S.; Abdollahi, K. Assessment of temperature and rainfall changes in the Karoun River basin. Theor. Appl. Climatol. 2019, 137, 2829–2839. [Google Scholar] [CrossRef]
- Statgraphics. In STATGRAPHICS® Centurion XVII User Manual; Statpoint Technologies, Inc.: Warrenton, VA, USA, 2014.
Figure 1.
Map of the study area: (a) sub-basins of Danube’s tributary Prut River in Romania (RO), Moldova (MD) and Ukraine (UA); (b) Prut River basin within Romania and Moldova, and selected hydrological and weather stations.
Figure 1.
Map of the study area: (a) sub-basins of Danube’s tributary Prut River in Romania (RO), Moldova (MD) and Ukraine (UA); (b) Prut River basin within Romania and Moldova, and selected hydrological and weather stations.

Figure 2.
Linear trends of air temperature in the Prut basin in two climatic periods: 1961–1990 and 1991–2018.
Figure 2.
Linear trends of air temperature in the Prut basin in two climatic periods: 1961–1990 and 1991–2018.


Figure 3.
Average monthly air temperatures (°C) in the Prut basin in two climatic periods.

Figure 4.
Linear trends of annual precipitation p (mm) in the Prut basin in two climatic periods.

Figure 5.
Monthly precipitation (mm) in the Prut basin in two climatic periods.

Figure 6.
Linear trends of the Prut’s annual water discharge (m3/s) in two climatic periods.

Figure 7.
The Prut’s monthly water discharge (m3/s) in two climatic periods.

Figure 8.
The Prut water monthly discharge (m3/s) at hydrological posts upstream (Radauti) and downstream (Stanca) of the Stanca-Costesti HPP in the periods 1950–1975 (left) and 1980–2017 (right).
Figure 8.
The Prut water monthly discharge (m3/s) at hydrological posts upstream (Radauti) and downstream (Stanca) of the Stanca-Costesti HPP in the periods 1950–1975 (left) and 1980–2017 (right).


Table 1.
Morphometric characteristics of hydrological stations on the Prut River in Romania [16].
Table 1.
Morphometric characteristics of hydrological stations on the Prut River in Romania [16].
| Hydrological Station | Operation from | Geographic Coordinates | Distance from the Mouth | Catchment Area | Elevation above Black Sea | ||
|---|---|---|---|---|---|---|---|
| Latitude | Longitude | Area, km2 | Altitude, m | ||||
| Radauti | 1950 | 48°14′55″ | 26°48′14″ | 652 km | 9074 | 529 | 101.9 |
| Stanca | 1950 | 47°47′00″ | 27°16′00″ | 554 km | 12,000 | 480 | 62.0 |
| Oancea | 1928 | 45°53′37″ | 28°03′04″ | 88 km | 26,874 | 279 | 6.3 |
Table 2.
Slope, coefficient of determination (R2) and statistical significance (p-value) of air temperature linear trends in the Prut River basin in two climatic periods.
Table 2.
Slope, coefficient of determination (R2) and statistical significance (p-value) of air temperature linear trends in the Prut River basin in two climatic periods.
| Season | 1961–1990 | 1991–2018 | ||||
|---|---|---|---|---|---|---|
| Slope | R2, % | p-Value | Slope | R2, % | p-Value | |
| Minimum temperature (Tmin) | ||||||
| Winter | 0.056 | 6.21 | 0.184 | 0.045 | 5.82 | 0.216 |
| Spring | 0.010 | 0.50 | 0.709 | 0.067 | 44.0 | 0.000 |
| Summer | −0.025 | 11.8 | 0.063 | 0.046 | 35.4 | 0.001 |
| Autumn | −0.038 | 12.1 | 0.059 | 0.064 | 27.0 | 0.005 |
| Year | 0.004 | 0.27 | 0.785 | 0.056 | 45.8 | 0.000 |
| Mean temperature (Tmean) | ||||||
| Winter | 0.059 | 7.32 | 0.148 | 0.042 | 5.24 | 0.241 |
| Spring | 0.008 | 0.26 | 0.790 | 0.098 | 51.7 | 0.000 |
| Summer | −0.024 | 7.32 | 0.148 | 0.079 | 38.5 | 0.000 |
| Autumn | −0.049 | 17.3 | 0.022 | 0.088 | 41.3 | 0.000 |
| Year | −0.001 | 0.02 | 0.940 | 0.076 | 53.3 | 0.000 |
| Maximum temperature (Tmax) | ||||||
| Winter | 0.072 | 10.8 | 0.010 | 0.042 | 4.33 | 0.288 |
| Spring | 0.007 | 0.09 | 0.872 | 0.121 | 46.3 | 0.000 |
| Summer | −0.034 | 9.76 | 0.092 | 0.104 | 38.3 | 0.000 |
| Autumn | −0.068 | 20.6 | 0.012 | 0.104 | 43.0 | 0.000 |
| Year | −0.007 | 0.34 | 0.759 | 0.093 | 52.3 | 0.000 |
Table 3.
Statistical comparison of air temperature (°C) in the Prut basin in two climatic periods.
| Season | Average ± Standard Error | Standard Deviation | ||||||
|---|---|---|---|---|---|---|---|---|
| 1961–1990 | 1991–2018 | Difference | p-Value | 1961–1990 | 1991–2018 | Difference | p-Value | |
| Minimum temperature (Tmin) | ||||||||
| Winter | −5.03 ± 0.36 | −3.97 ± 0.29 | 1.06 | 0.027 | 1.97 | 1.53 | −0.44 | 0.184 |
| Spring | 4.86 ± 0.22 | 5.76 ± 0.16 | 0.90 | 0.002 | 1.18 | 0.84 | −0.34 | 0.072 |
| Summer | 14.41 ± 0.12 | 15.99 ± 0.12 | 1.58 | 0.000 | 0.65 | 0.63 | −0.02 | 0.912 |
| Autumn | 5.91 ± 0.25 | 6.56 ± 0.24 | 0.65 | 0.017 | 1.38 | 1.28 | −0.10 | 0.803 |
| Year | 5.07 ± 0.13 | 6.11 ± 0.13 | 1.04 | 0.000 | 0.73 | 0.68 | −0.05 | 0.712 |
| Mean temperature (Tmean) | ||||||||
| Winter | −2.34 ± 0.35 | −1.35 ± 0.29 | 0.99 | 0.034 | 1.91 | 1.52 | −0.39 | 0.235 |
| Spring | 9.27 ± 0.27 | 10.41 ± 0.22 | 1.14 | 0.002 | 1.46 | 1.12 | −0.34 | 0.164 |
| Summer | 19.59 ± 0.14 | 21.30 ± 0.20 | 1.71 | 0.000 | 0.79 | 1.05 | 0.26 | 0.143 |
| Autumn | 9.85 ± 0.19 | 10.34 ± 0.21 | 0.49 | 0.091 | 1.04 | 1.13 | 0.09 | 0.672 |
| Year | 9.09 ± 0.14 | 10.20 ± 0.16 | 1.11 | 0.001 | 0.79 | 0.85 | 0.06 | 0.697 |
| Maximum temperature (Tmax) | ||||||||
| Winter | 0.78 ± 0.35 | 1.80 ± 0.31 | 1.02 | 0.035 | 1.92 | 1.66 | −0.26 | 0.455 |
| Spring | 14.49 ± 0.35 | 15.98 ± 0.28 | 1.49 | 0.002 | 1.91 | 1.47 | −0.44 | 0.173 |
| Summer | 25.38 ± 0.17 | 27.32 ± 0.26 | 1.94 | 0.000 | 0.95 | 1.38 | 0.43 | 0.050 |
| Autumn | 14.77 ± 0.24 | 15.07 ± 0.25 | 0.30 | 0.386 | 1.31 | 1.31 | 0.00 | 0.988 |
| Year | 13.85 ± 0.18 | 15.06 ± 0.20 | 1.21 | 0.000 | 0.99 | 1.06 | 0.07 | 0.716 |
Table 4.
Statistics of linear trends of precipitation in the Prut River basin.
| Season | Period | Slope | R2, % | p-Value | Period | Slope | R2, % | p-Value |
|---|---|---|---|---|---|---|---|---|
| Winter | 1961–1990 | −1.341 | 6.10 | 0.188 | 1991–2018 | 1.328 | 7.49 | 0.159 |
| Spring | −0.464 | 0.94 | 0.610 | −0.320 | 0.33 | 0.771 | ||
| Summer | 0.209 | 0.15 | 0.837 | −1.067 | 2.25 | 0.447 | ||
| Autumn | 0.480 | 0.57 | 0.691 | −0.516 | 0.45 | 0.734 | ||
| Year | −2.066 | 3.43 | 0.327 | −0.596 | 0.24 | 0.806 |
Note: Symbolic notation—see Table 2.
Table 5.
Statistical comparison of Prut basin precipitation p (mm) in two climatic periods.
| Season | Average ± Standard Error | Standard Deviation | ||||||
|---|---|---|---|---|---|---|---|---|
| 1961–1990 | 1991–2018 | Difference | p-Value | 1961–1990 | 1991–2018 | Difference | p-Value | |
| Winter | 108.5 ± 8.7 | 93.4 ± 7.5 | −15.1 | 0.200 | 47.8 | 39.9 | −7.9 | 0.348 |
| Spring | 135.8 ± 7.7 | 133.3 ± 8.6 | −2.5 | 0.830 | 42.1 | 45.7 | 3.6 | 0.662 |
| Summer | 211.7 ± 8.6 | 202.5 ± 11.1 | −9.2 | 0.512 | 47.0 | 58.5 | 11.5 | 0.248 |
| Autumn | 111.7 ± 10.2 | 133.6 ± 11.9 | 21.9 | 0.166 | 55.8 | 63.1 | −8.1 | 0.520 |
| Year | 567.3 ± 17.9 | 565.9 ± 19.1 | −1.4 | 0.957 | 98.2 | 100.8 | 2.6 | 0.889 |
Table 6.
Slope, coefficient of determination (R2) and statistical significance (p-value) of linear trends of the Prut River’s water discharge (m3/s) in two climatic periods.
Table 6.
Slope, coefficient of determination (R2) and statistical significance (p-value) of linear trends of the Prut River’s water discharge (m3/s) in two climatic periods.
| Season | 1961–1990 | 1991–2017 | ||||
|---|---|---|---|---|---|---|
| Slope | R2, % | p-Value | Slope | R2, % | p-Value | |
| Winter | 0.480 | 5.30 | 0.221 | −0.180 | 1.13 | 0.598 |
| Spring | −0.556 | 1.06 | 0.589 | −1.189 | 6.36 | 0.204 |
| Summer | 1.017 | 2.95 | 0.364 | −0.526 | 0.30 | 0.786 |
| Autumn | 0.401 | 1.43 | 0.530 | −1.273 | 15.91 | 0.039 |
| Year | 0.335 | 1.17 | 0.570 | −0.792 | 4.56 | 0.285 |
Table 7.
Statistical comparison of the Prut’s water discharge (m3/s) in two climatic periods at Radauti hydrological post.
Table 7.
Statistical comparison of the Prut’s water discharge (m3/s) in two climatic periods at Radauti hydrological post.
| Season | Average ± Standard Error | Standard Deviation | ||||||
|---|---|---|---|---|---|---|---|---|
| 1961–1990 | 1991–2017 | Difference | p-Value | 1961–1990 | 1991–2017 | p-Value | ||
| Absolute | % | |||||||
| Winter | 37.5 ± 3.4 | 43.1 ± 2.6 | 5.6 | 14.9 | 0.203 | 18.4 | 13.4 | 0.110 |
| Spring | 124.9 ± 8.7 | 112.8 ± 7.2 | −12.1 | −9.7 | 0.295 | 47.6 | 37.4 | 0.220 |
| Summer | 113.4 ± 9.5 | 108.2 ± 14.6 | −5.2 | −4.6 | 0.765 | 52.2 | 76.1 | 0.050 |
| Autumn | 51.6 ± 5.4 | 57.0 ± 4.9 | 5.4 | 10.5 | 0.459 | 29.6 | 25.3 | o.428 |
| Year | 81.8 ± 4.1 | 80.3 ± 5.7 | −1.5 | −1.8 | 0.836 | 27.3 | 29.4 | 0.687 |
Table 8.
Statistical comparison of the Prut basin discharge (m3/s) upstream and downstream from the HPP.
Table 8.
Statistical comparison of the Prut basin discharge (m3/s) upstream and downstream from the HPP.
| Post | Season | Average ± Standard Error | Standard Deviation | ||||||
|---|---|---|---|---|---|---|---|---|---|
| 1950–1975 | 1980–2017 | Difference | p-Value | 1950–1975 | 1980–2017 | p-Value | |||
| Abs. | % | ||||||||
| Radauti | Winter | 36.0 ± 3.2 | 41.9 ± 3.0 | 5.9 | 16.4 | 0.141 | 15.9 | 15.5 | 0.865 |
| Spring | 114.7 ± 7.7 | 113.7 ± 7.8 | −1.0 | −0.8 | 0.920 | 38.6 | 40.6 | 0.830 | |
| Summer | 98.9 ± 12.9 | 109.9 ± 13.3 | 11.0 | 11.1 | 0.524 | 64.5 | 69.2 | 0.721 | |
| Autumn | 45.2 ± 5.0 | 53.8 ± 4.9 | 8.6 | 19.0 | 0.182 | 25.0 | 25.3 | 0.952 | |
| Year | 73.7 ± 4.7 | 79.8 ± 4.5 | 6.1 | 8.3 | 0.384 | 23.6 | 29.7 | 0.229 | |
| Stanca | Winter | 38.6 ± 3.2 | 50.5 ± 4.0 | 11.9 | 30.8 | 0.017 | 16.1 | 20.9 | 0.181 |
| Spring | 118.3 ± 7.9 | 93.4 ± 7.7 | −24.9 | −21.0 | 0.016 | 39.5 | 39.9 | 0.974 | |
| Summer | 101.9 ± 13.2 | 118.0 ± 3.2 | 16.1 | 15.8 | 0.331 | 66.1 | 63.6 | 0.819 | |
| Autumn | 47.4 ± 5.1 | 65.0 ± 5.6 | 17.6 | 37.1 | 0.016 | 25.4 | 29.3 | 0.457 | |
| Year | 76.6 ± 4.8 | 81.7 ± 5.6 | 5.1 | 6.7 | 0.458 | 24.0 | 29.1 | 0.320 | |
Publisher’s Note: MDPI stays neutral with regard to jurisdictional claims in published maps and institutional affiliations. |
© 2020 by the authors. Licensee MDPI, Basel, Switzerland. This article is an open access article distributed under the terms and conditions of the Creative Commons Attribution (CC BY) license (http://creativecommons.org/licenses/by/4.0/).
Share and Cite
MDPI and ACS Style
Corobov, R.; Ene, A.; Trombitsky, I.; Zubcov, E. The Prut River under Climate Change and Hydropower Impact. Sustainability 2021, 13, 66. https://doi.org/10.3390/su13010066
AMA Style
Corobov R, Ene A, Trombitsky I, Zubcov E. The Prut River under Climate Change and Hydropower Impact. Sustainability. 2021; 13(1):66. https://doi.org/10.3390/su13010066
Chicago/Turabian StyleCorobov, Roman, Antoaneta Ene, Ilya Trombitsky, and Elena Zubcov. 2021. "The Prut River under Climate Change and Hydropower Impact" Sustainability 13, no. 1: 66. https://doi.org/10.3390/su13010066
Note that from the first issue of 2016, this journal uses article numbers instead of page numbers. See further details here.